As the final project for my Systems class at CMU, we were asked to choose a wicked problem from a list of 11 problems facing Pittsburgh in the 21st century. My team chose the issue of rising adolescent depression and suicide rates.
Our assignment was to create a mess map, or a giga map, of our wicked problem in order to fully understand its complexity, reach a consensus on its significance, and identify steps needed to be taken in the future to resolve the problem.
What is a wicked problem?
Wicked problems are real-world, complex problems that do not have a straight-forward solution. They involve a large number of diverse factors and stakeholders, each with its own set of interconnected relationships, and will span over a significant period of time.
Rising adolescent depression and suicide rates is a wicked problem primarily because there isn't one clear cause, and therefore one clear solution. This problem began over a decade ago and has since been rapidly increasing in severity. In order to reach any kind of resolution, we needed to propose feasible interventions and determine where these interventions needed to occur.
MESS MAPPING:
Mess maps help create a shared mental model of a problem by clearly defining the major factors and their relationships. They also help ground a large-scale, complex problem like ours by breaking it down into small-scale components.
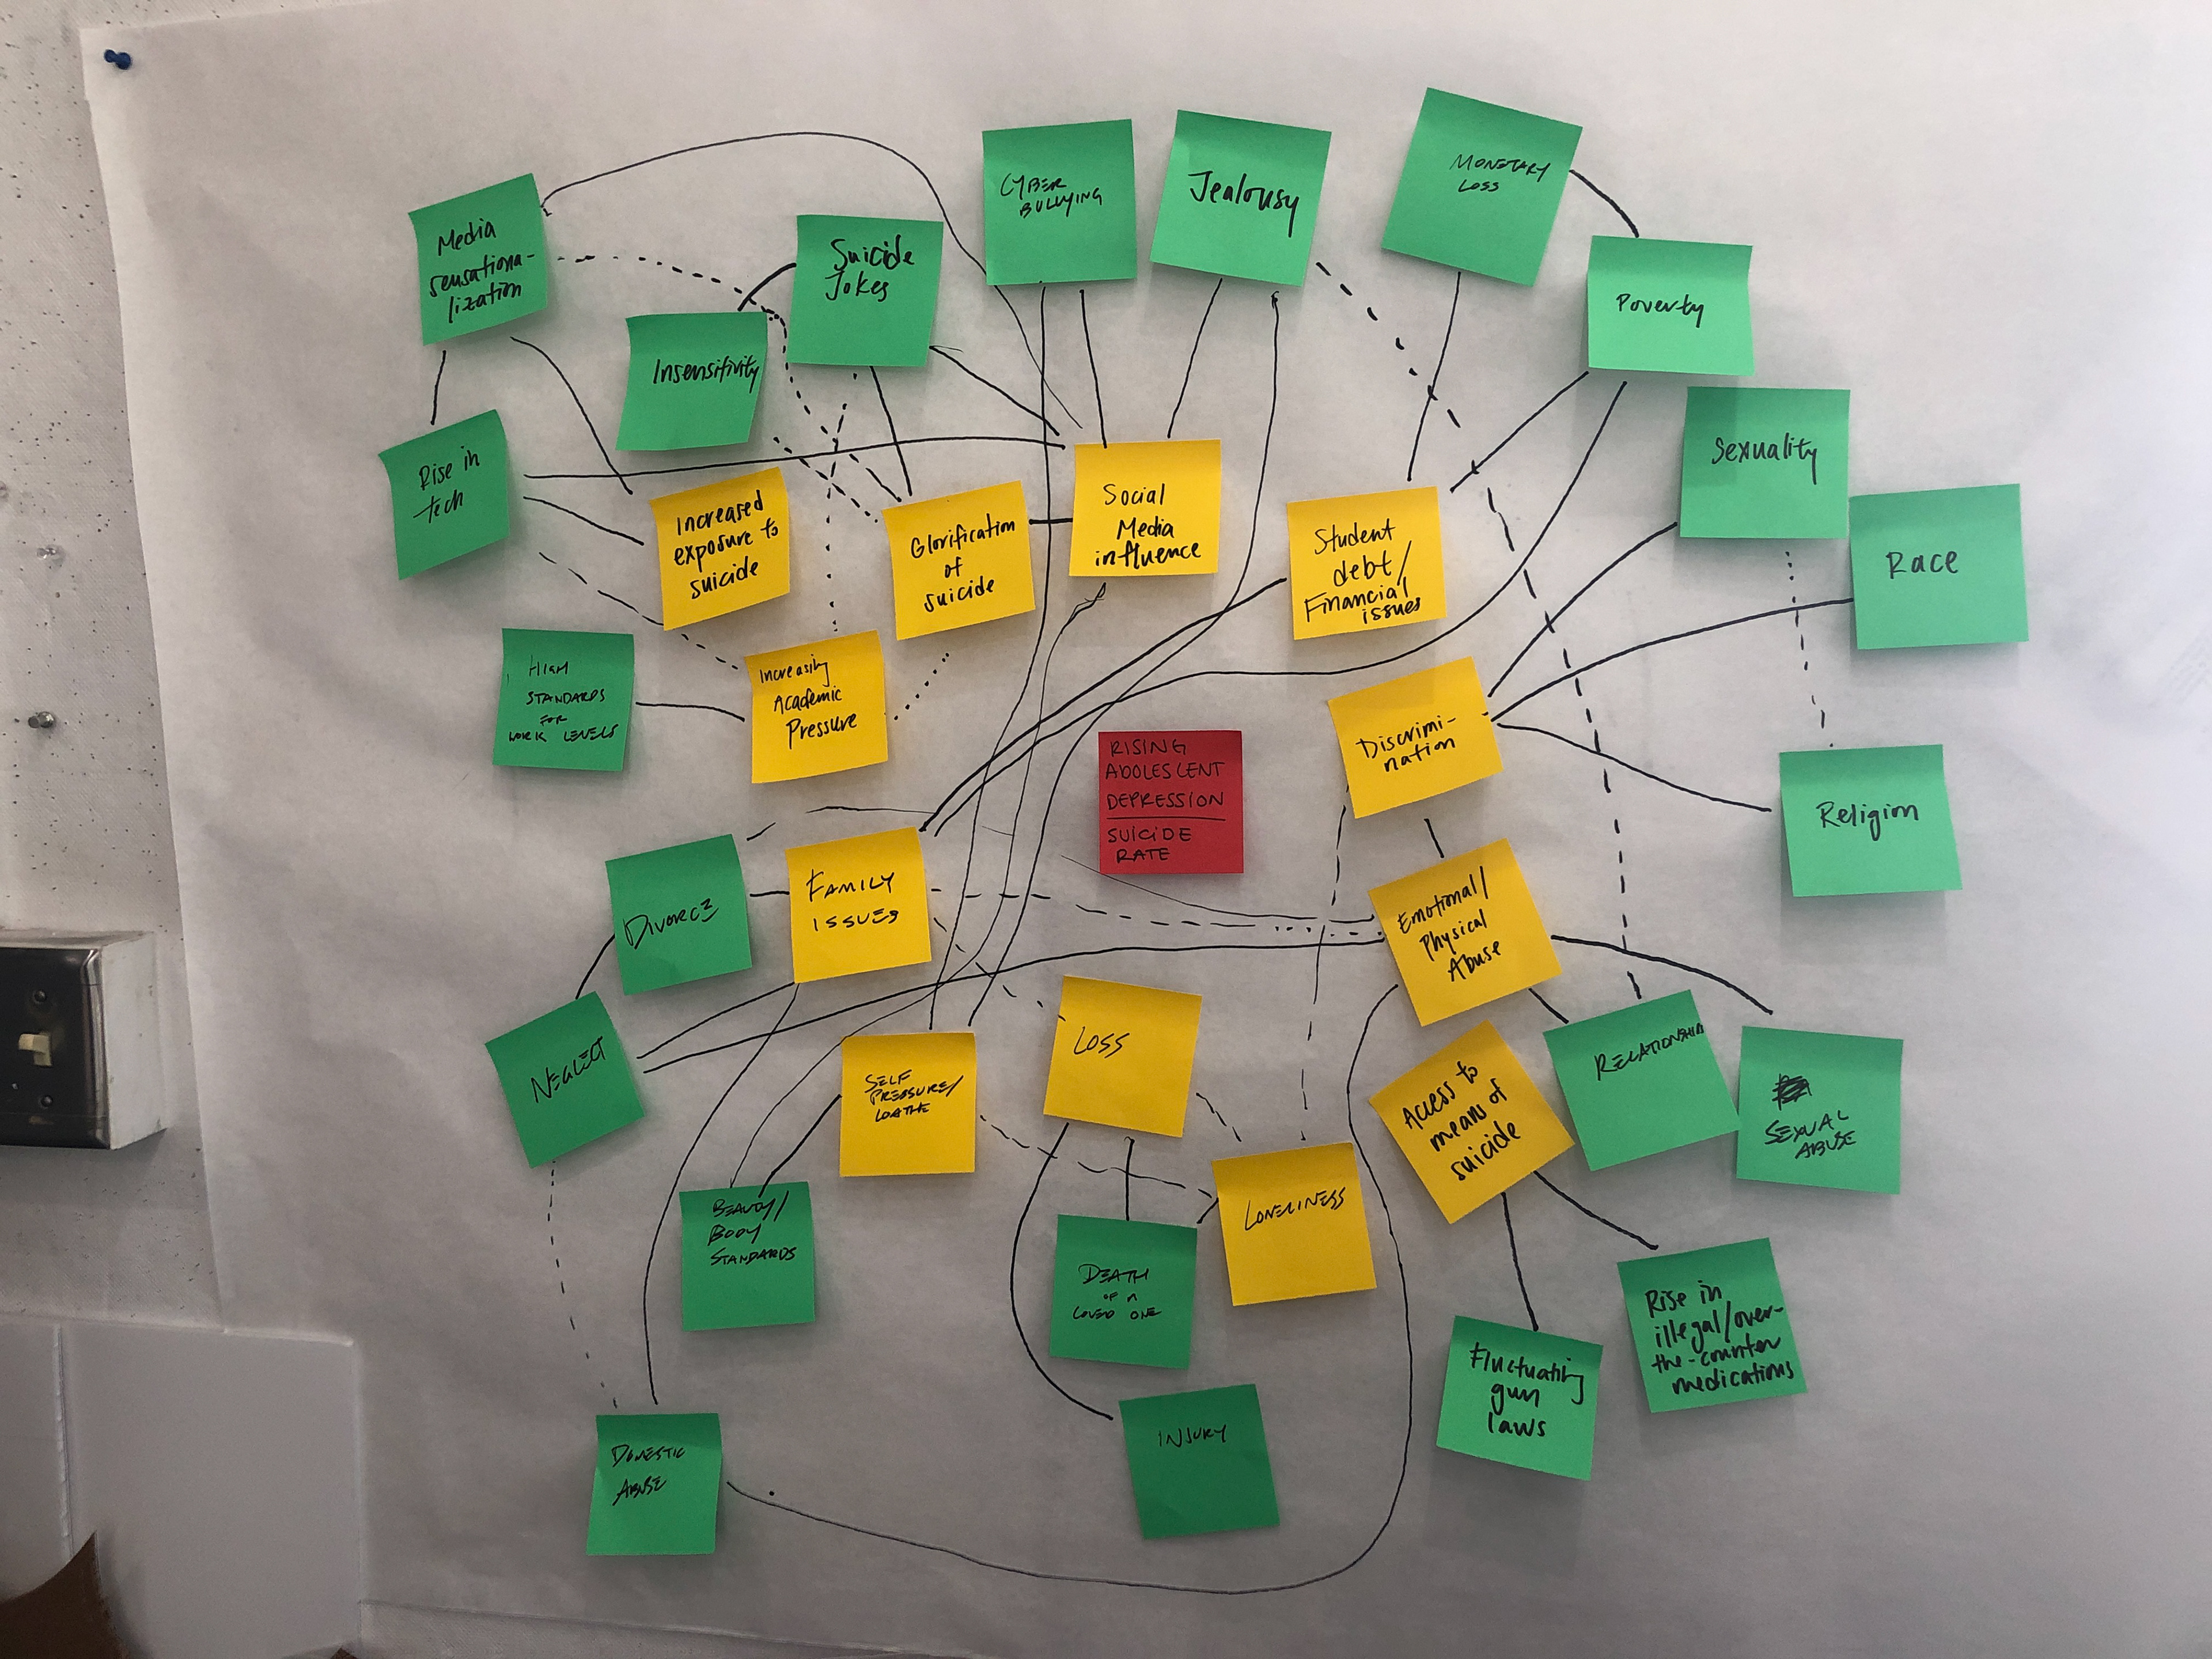
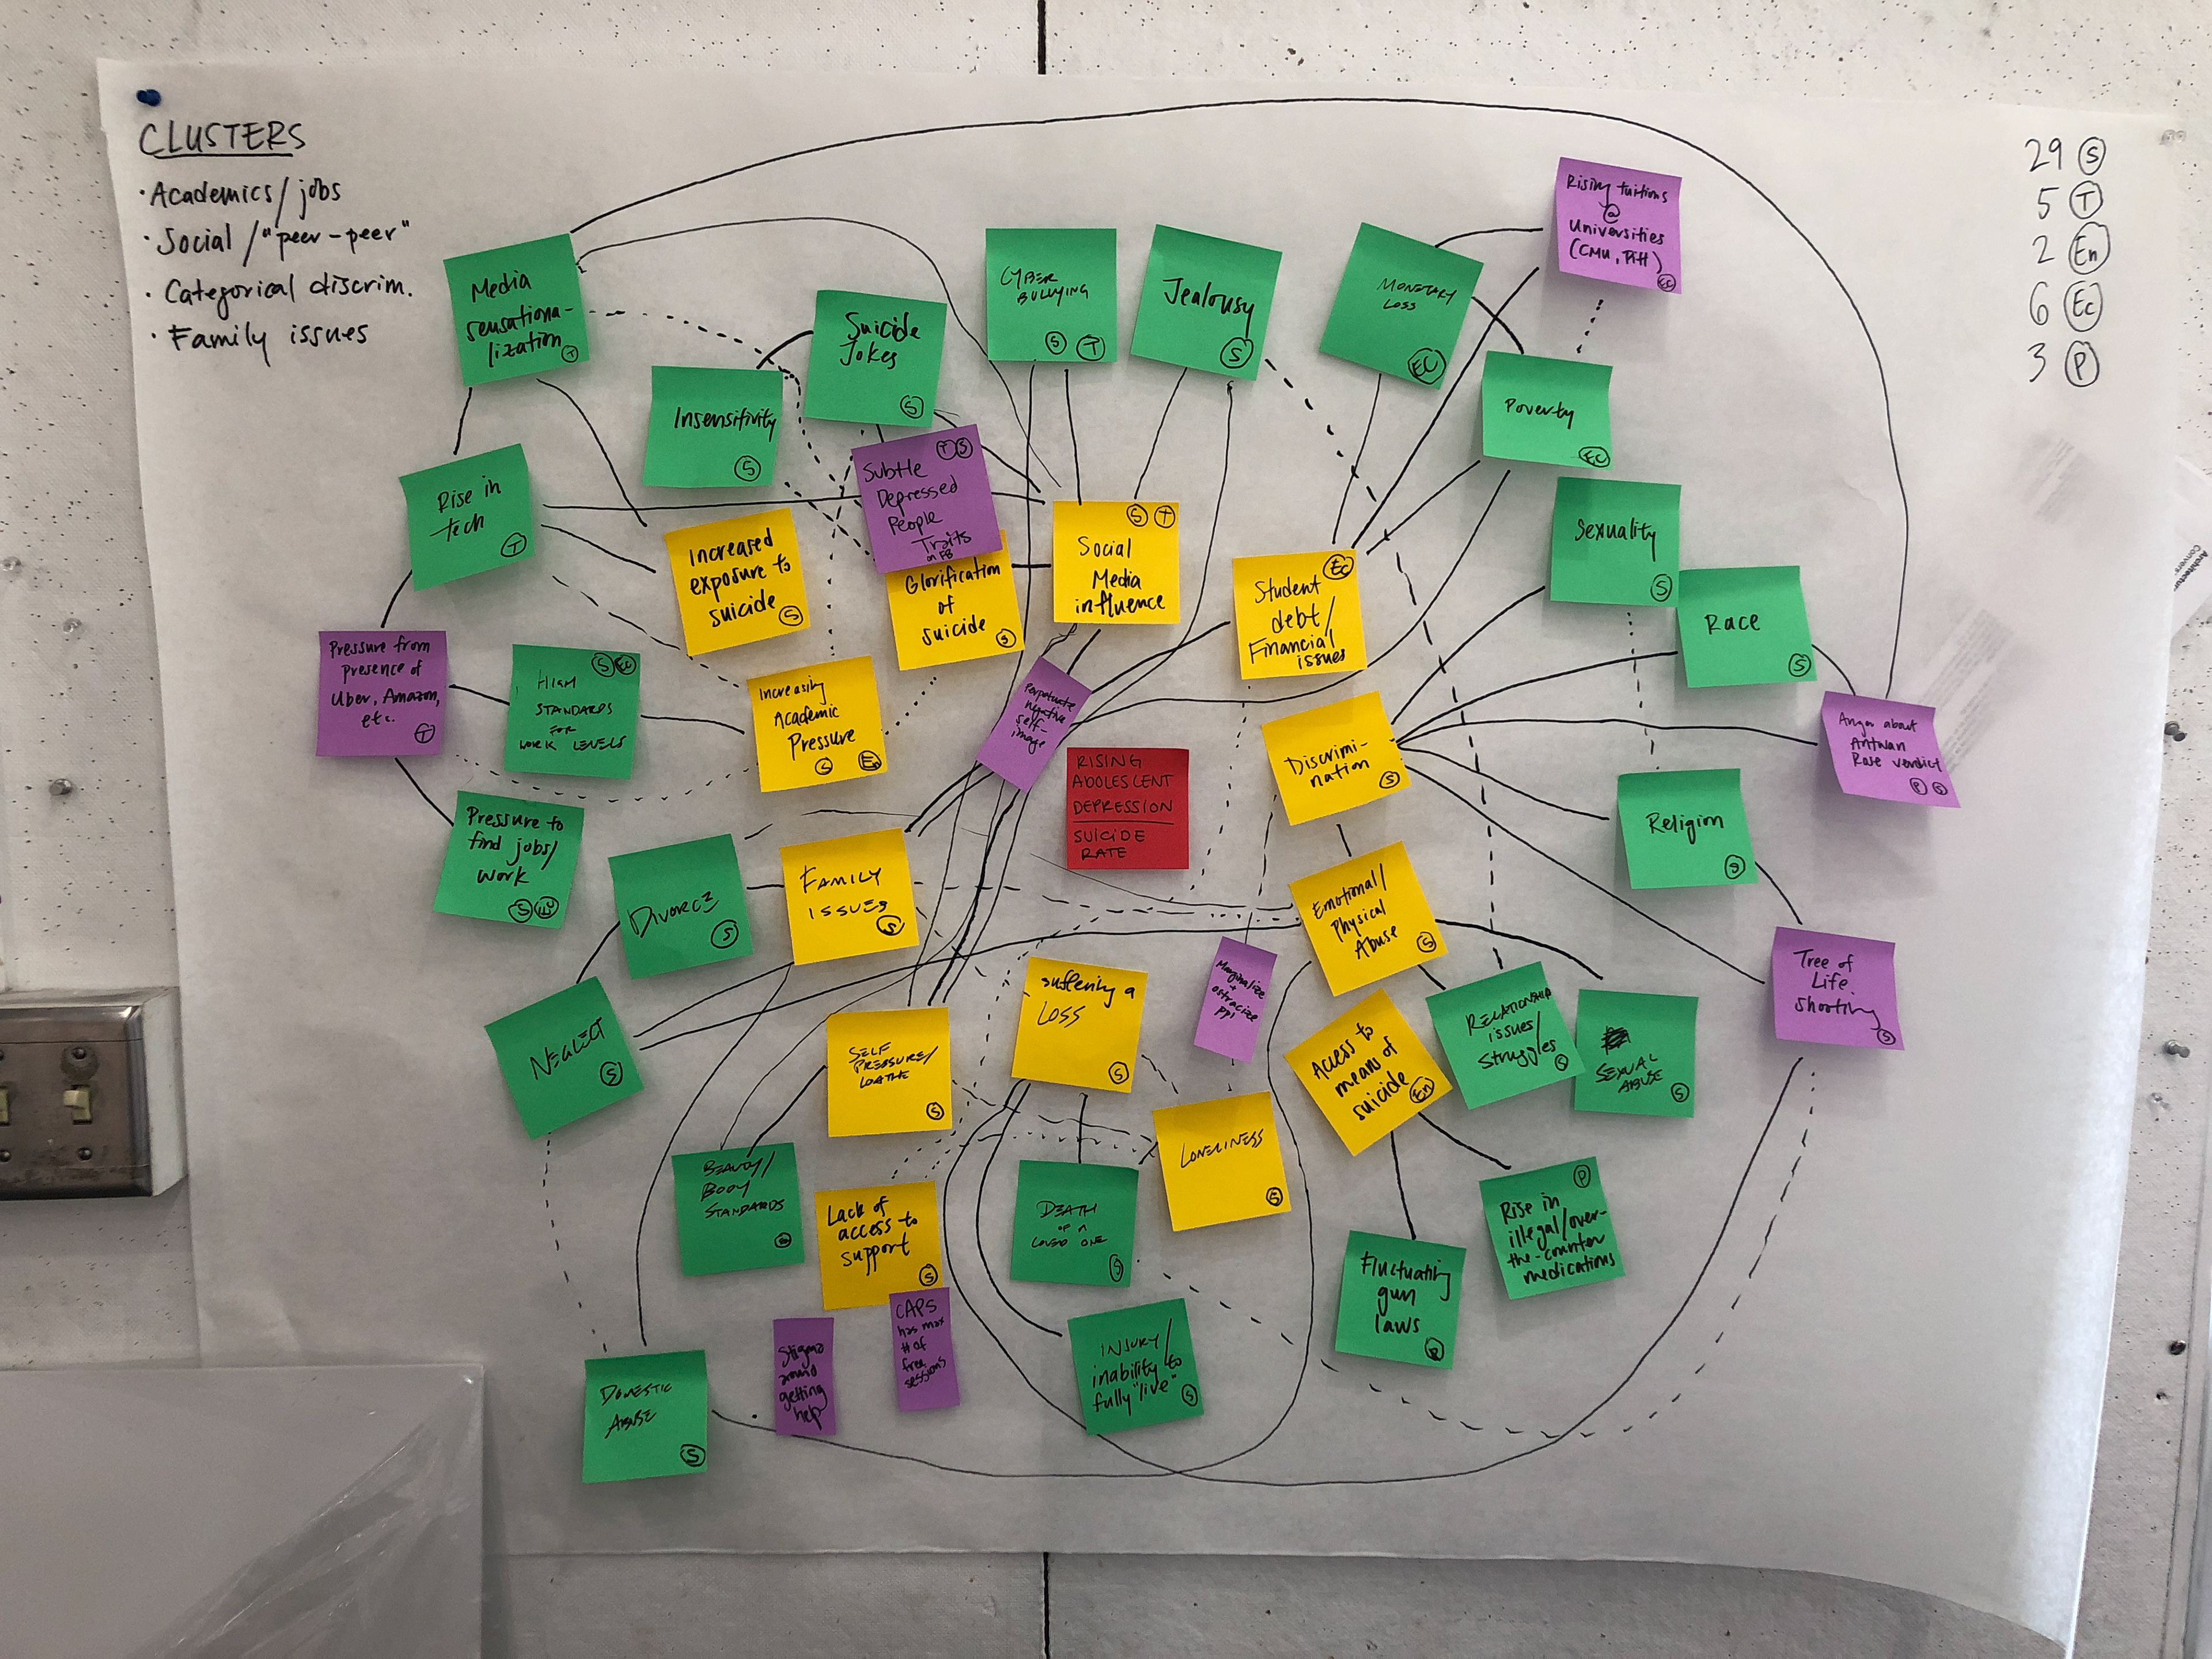
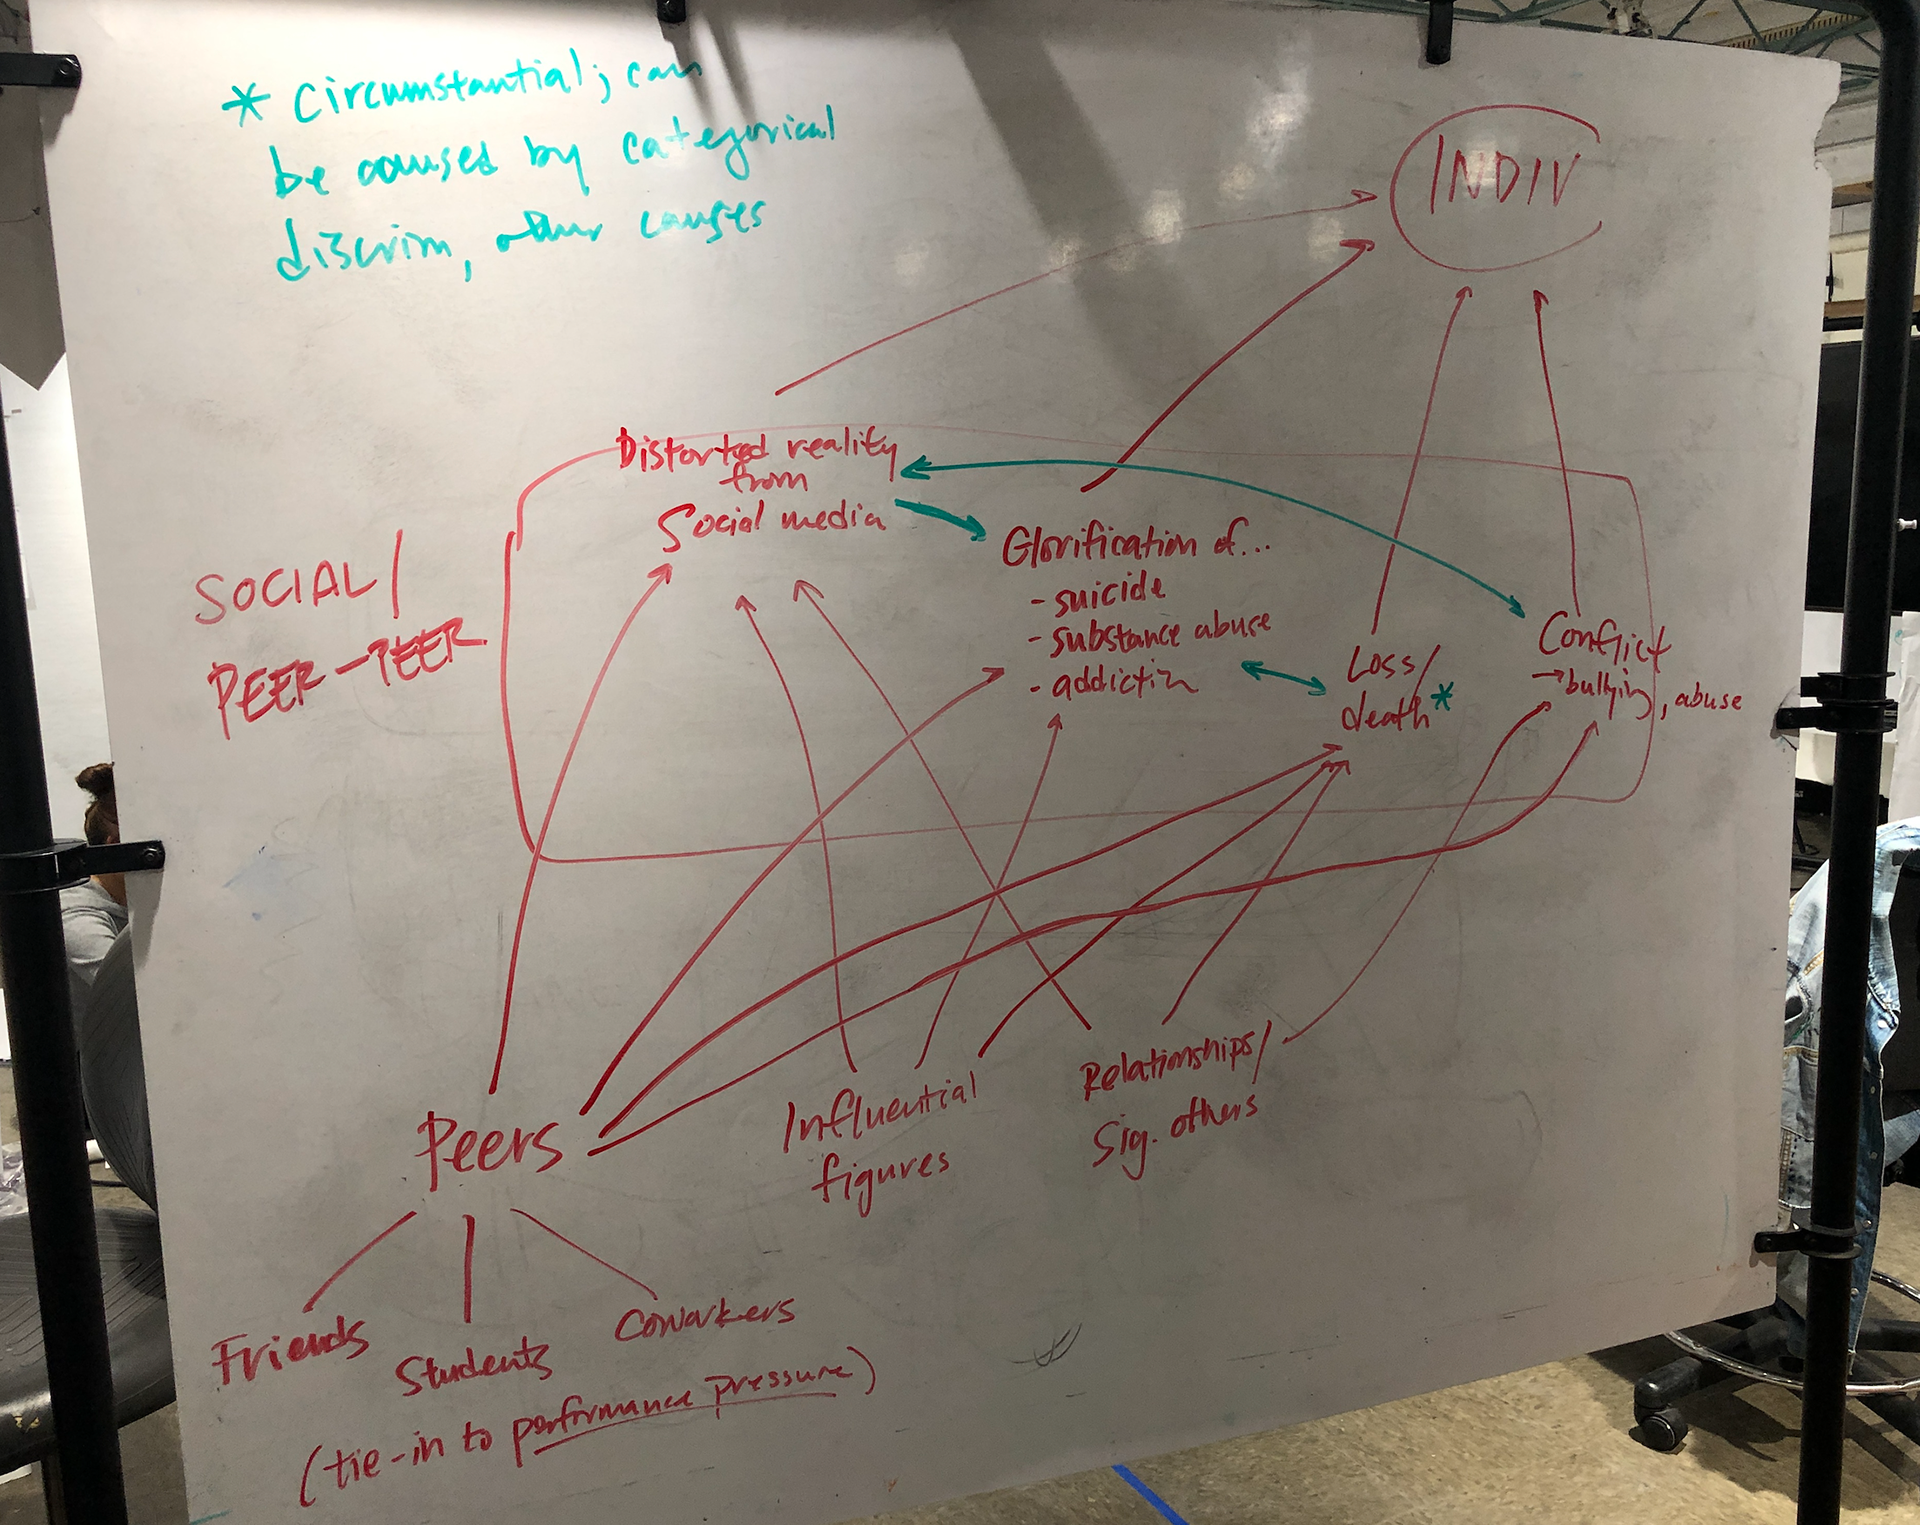
To begin our mess map, we first created a rough draft using butcher paper and sticky notes. We started with our wicked problem in the middle on a red sticky note, and radiated outward with primary and secondary causes of the problem, in yellow and green sticky notes respectfully. Then, we drew lines to indicate relationships, with bold lines indicating direct relationships, and dashed lines indicating indirect relationships. We added purple sticky notes as examples of events in Pittsburgh from current/recent history to further ground our map.
STEEP ANALYSIS
After placing all sticky notes, we used STEEP analysis to find trends in our map. We categorized each sticky note as a Social, Technological, Economical, Environmental, or Political factor (or more than one). Using this analysis we were able to identify four rough clusters among our map: Performance Pressure (academic/job performance), Social Issues (social/peer-peer), Categorical Discrimination, and Family Issues.
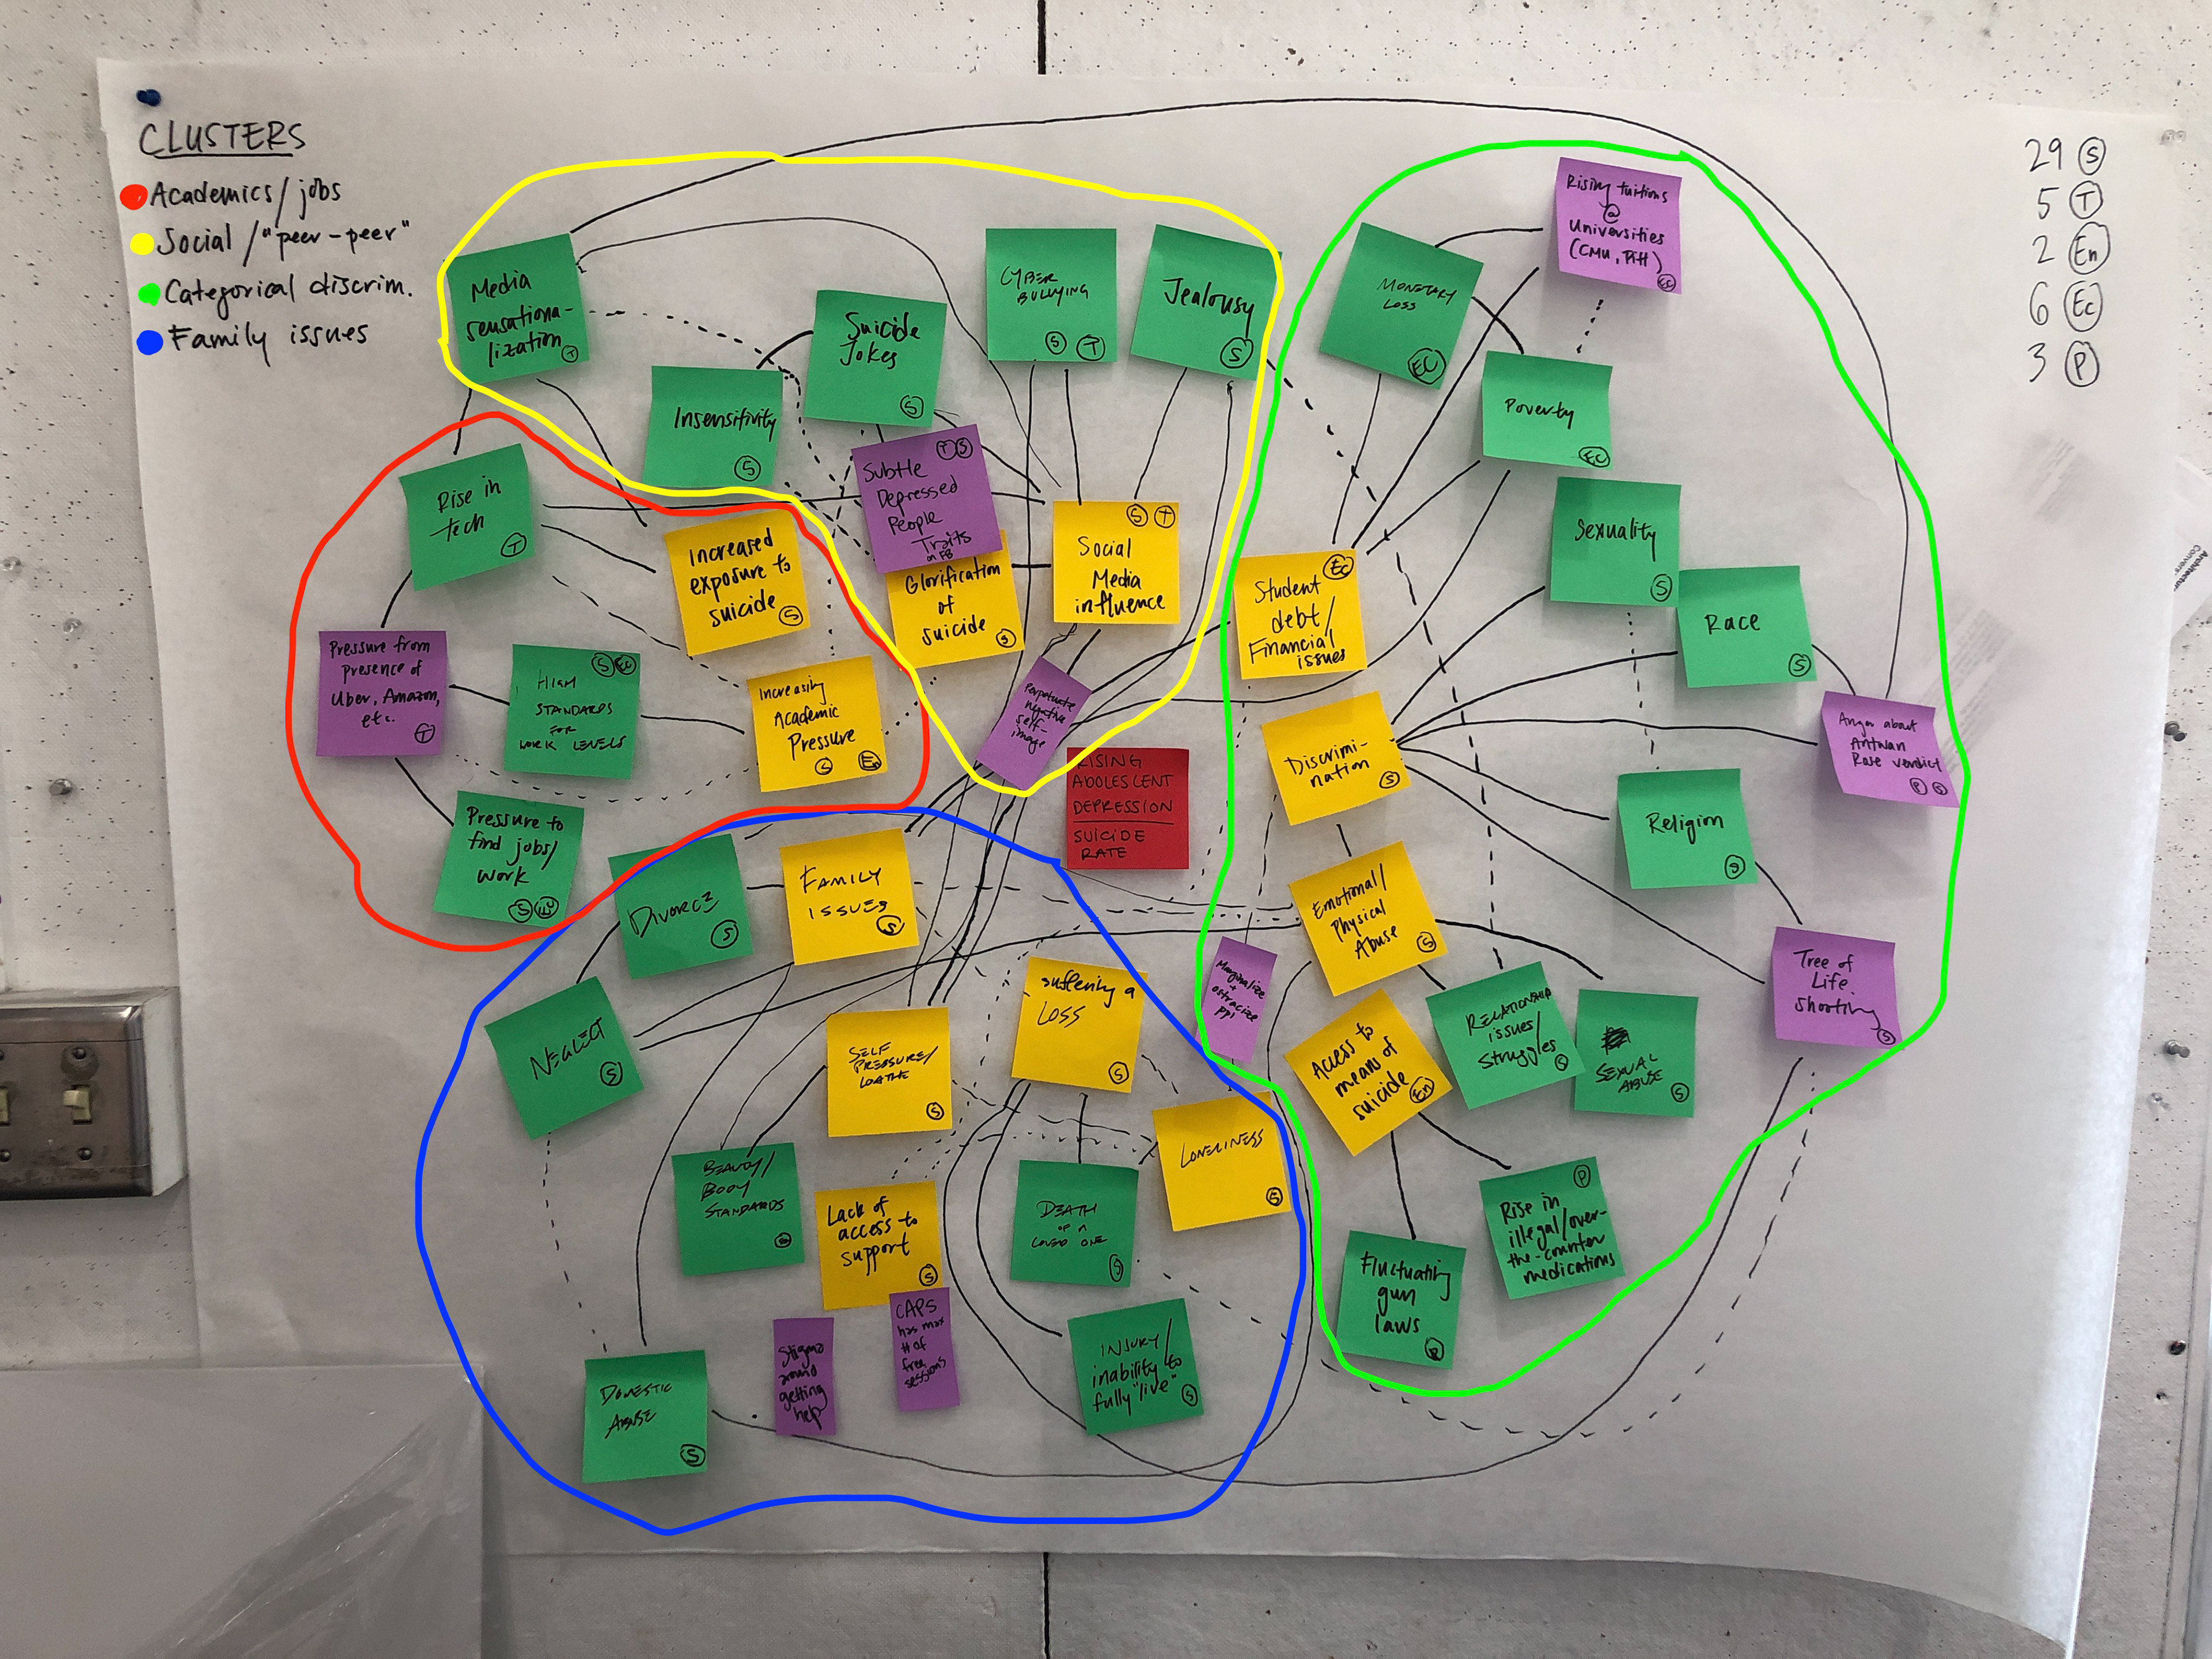
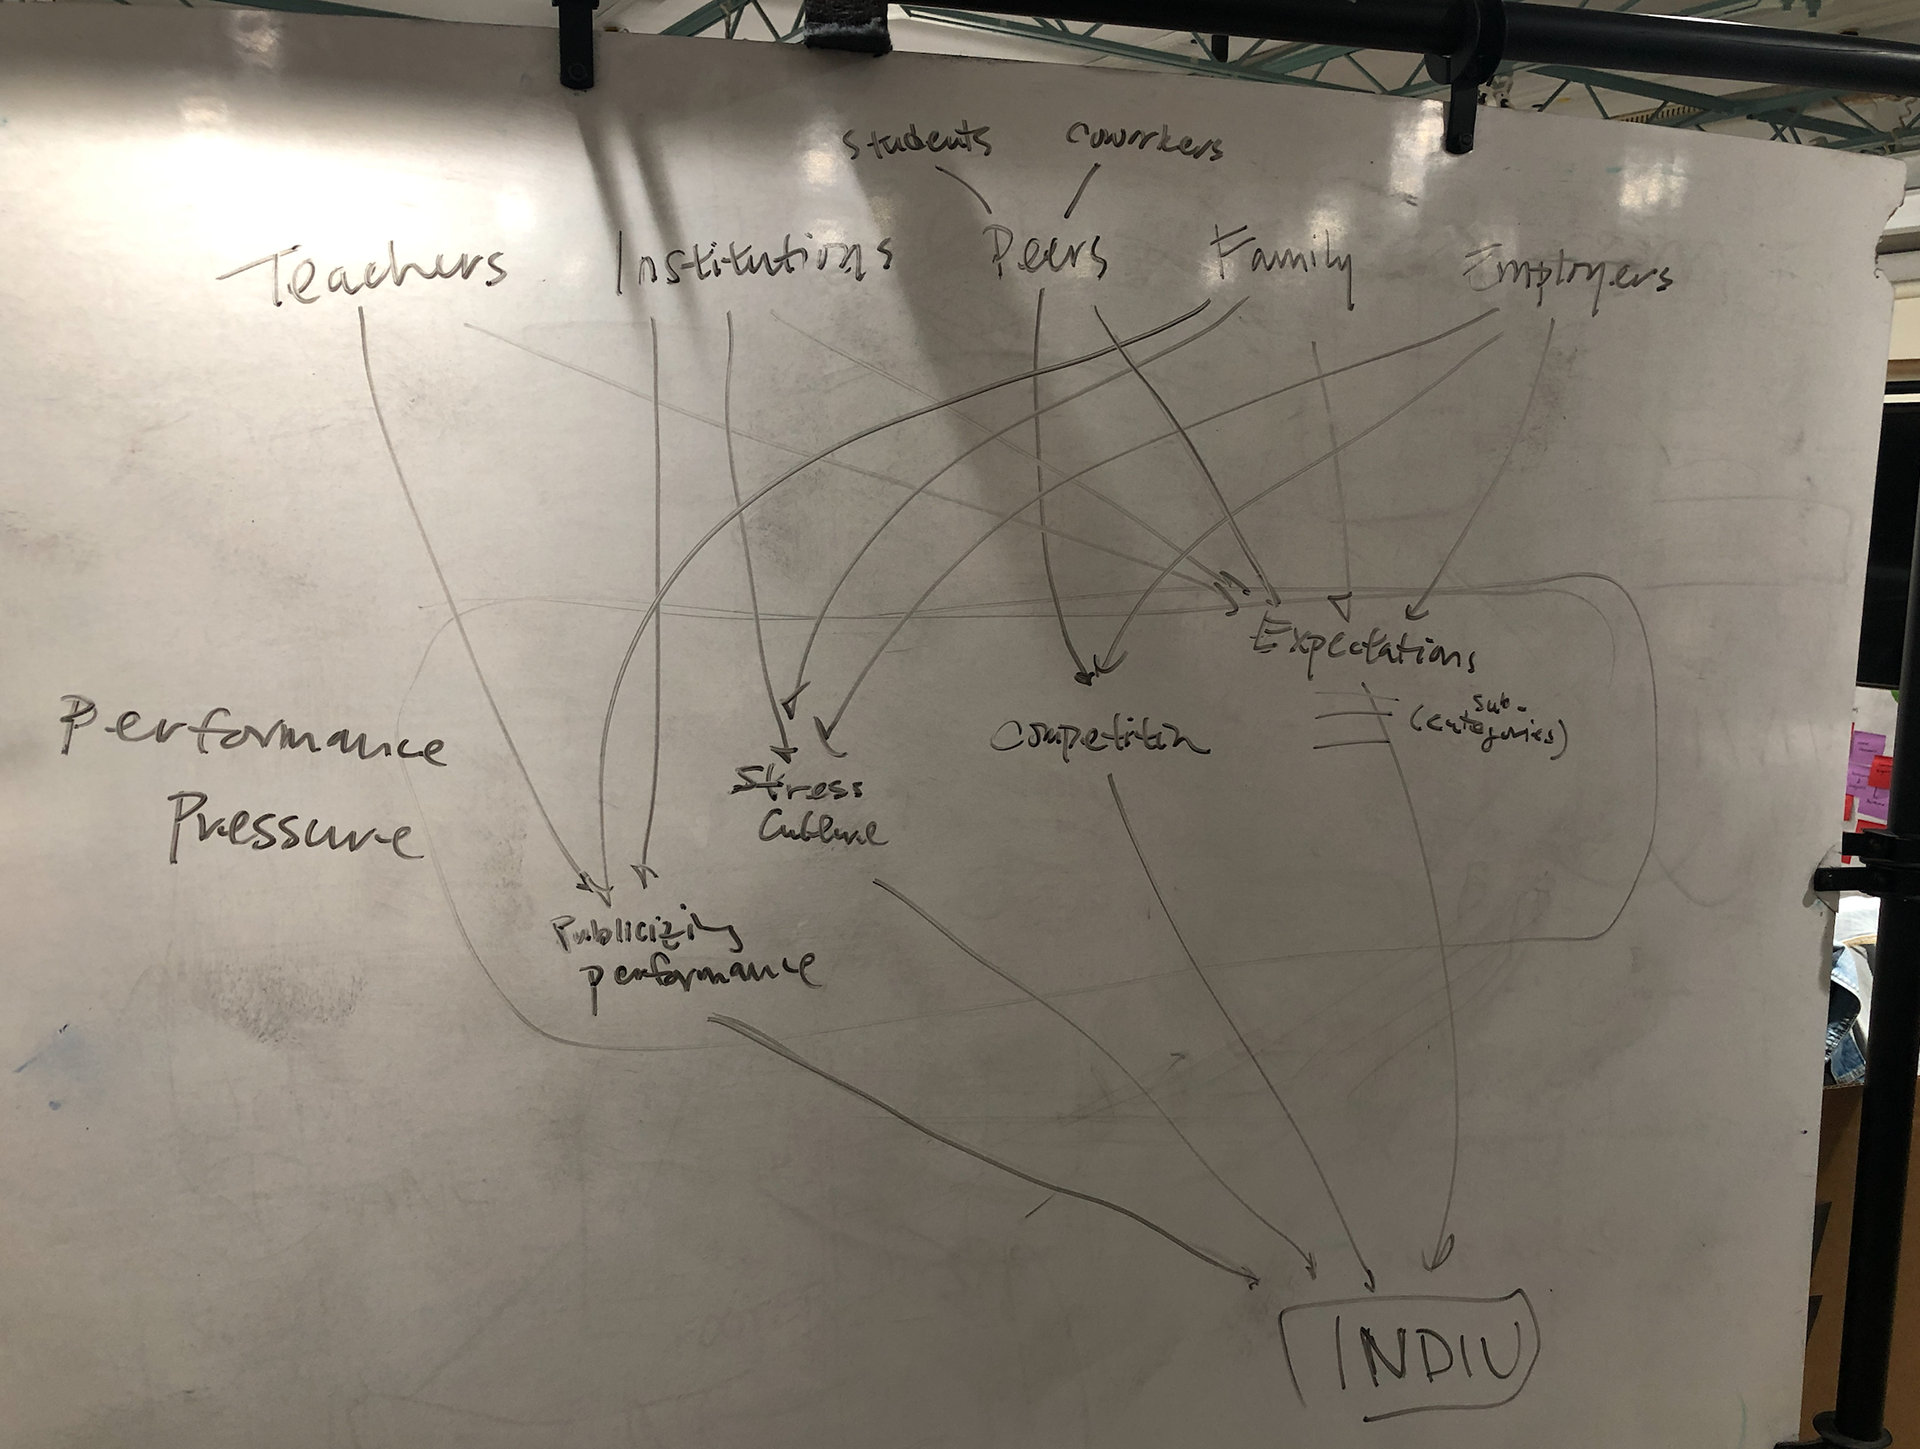
From there, we created rough submaps that identified subclusters and stakeholders within each cluster.


RESEARCH
After we established most of the main components of our map, we began research on statistics, evidence, Pennsylvania-specific events, and pre-existing interventions pertaining to adolescent depression/suicide.
MAP ITERATION 1:
This iteration is rough and very different from our final map, but it was a step in the right direction.
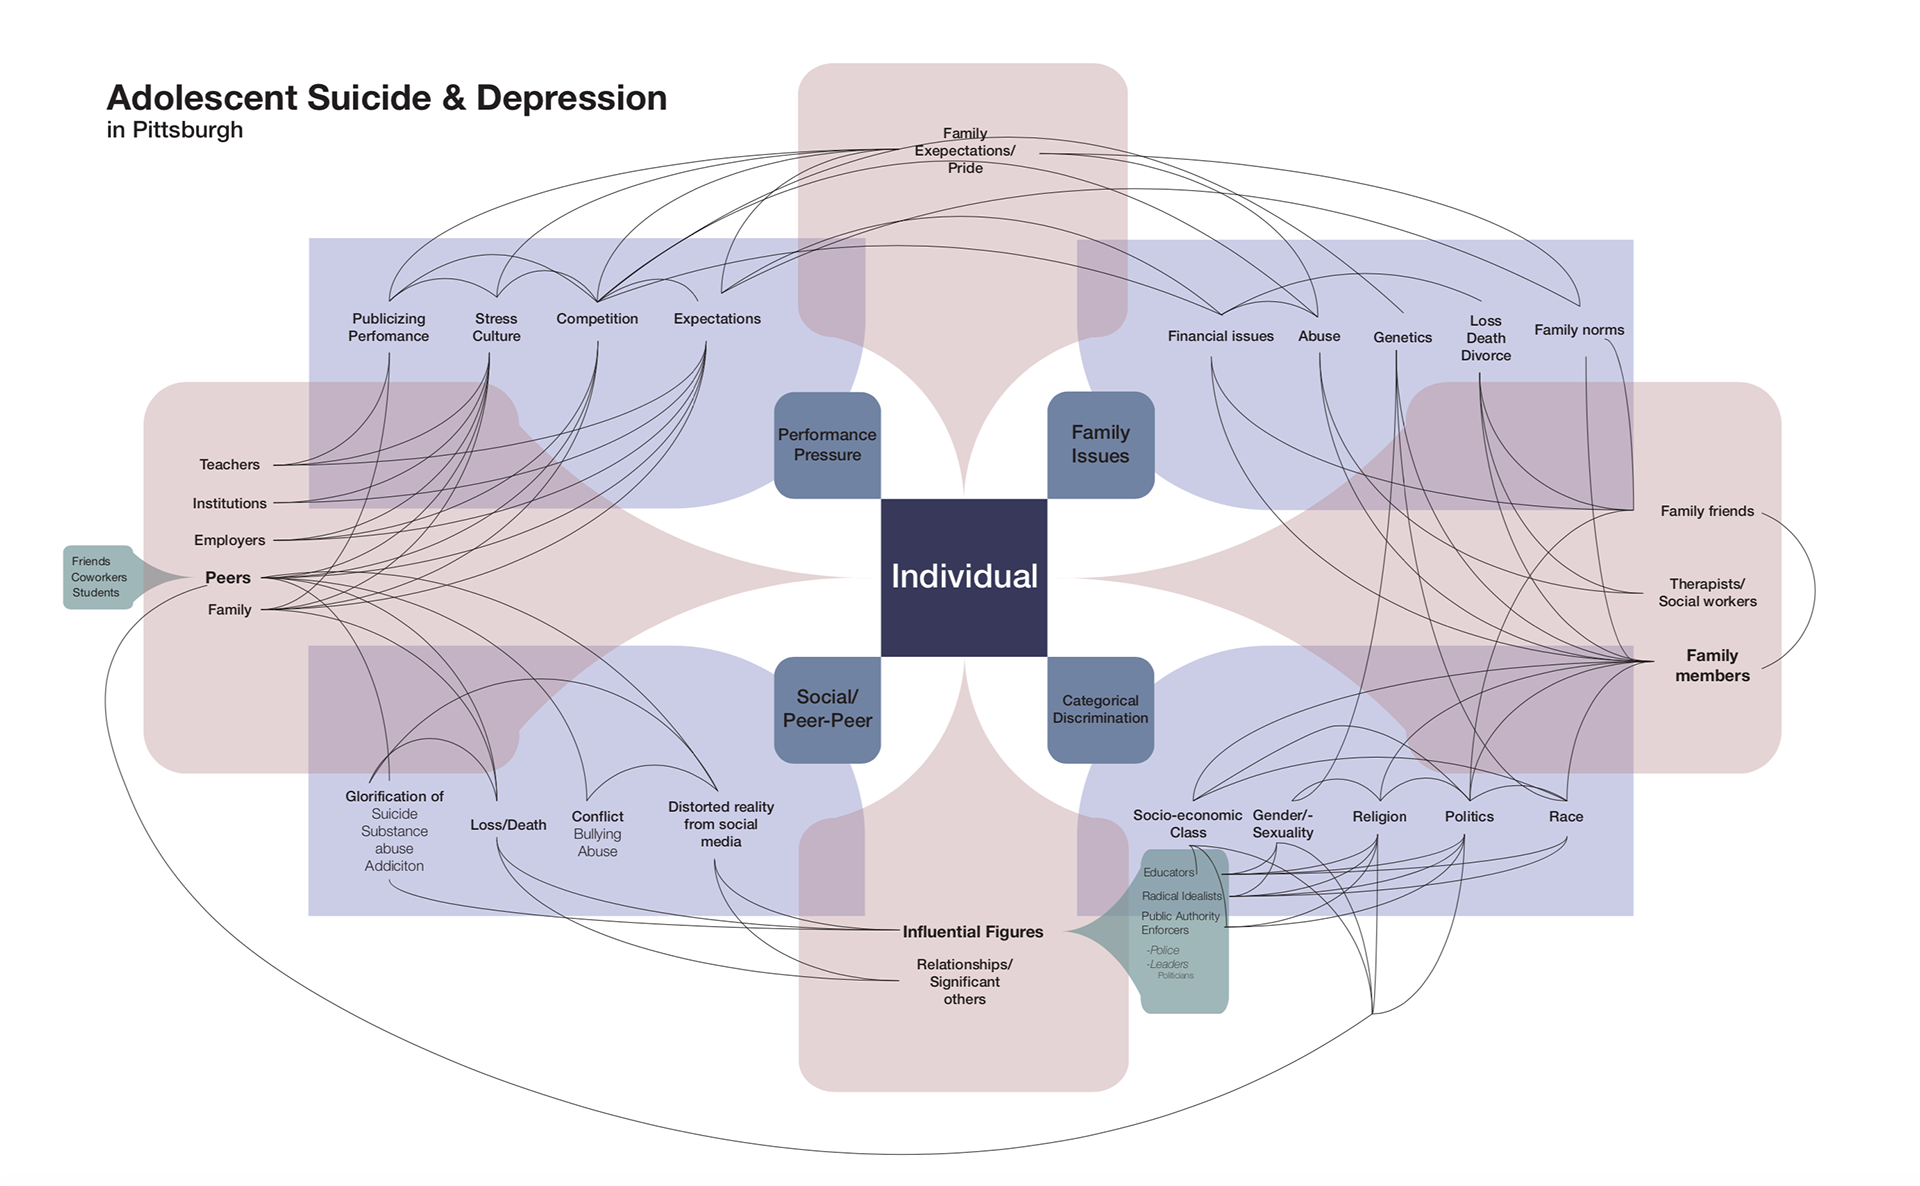
MAP ITERATION 2:
Our first iteration did not accurately convey the complexity of our problem, and although the map was supposed to be messy, the lines signifying connections were too confusing and not significant enough.
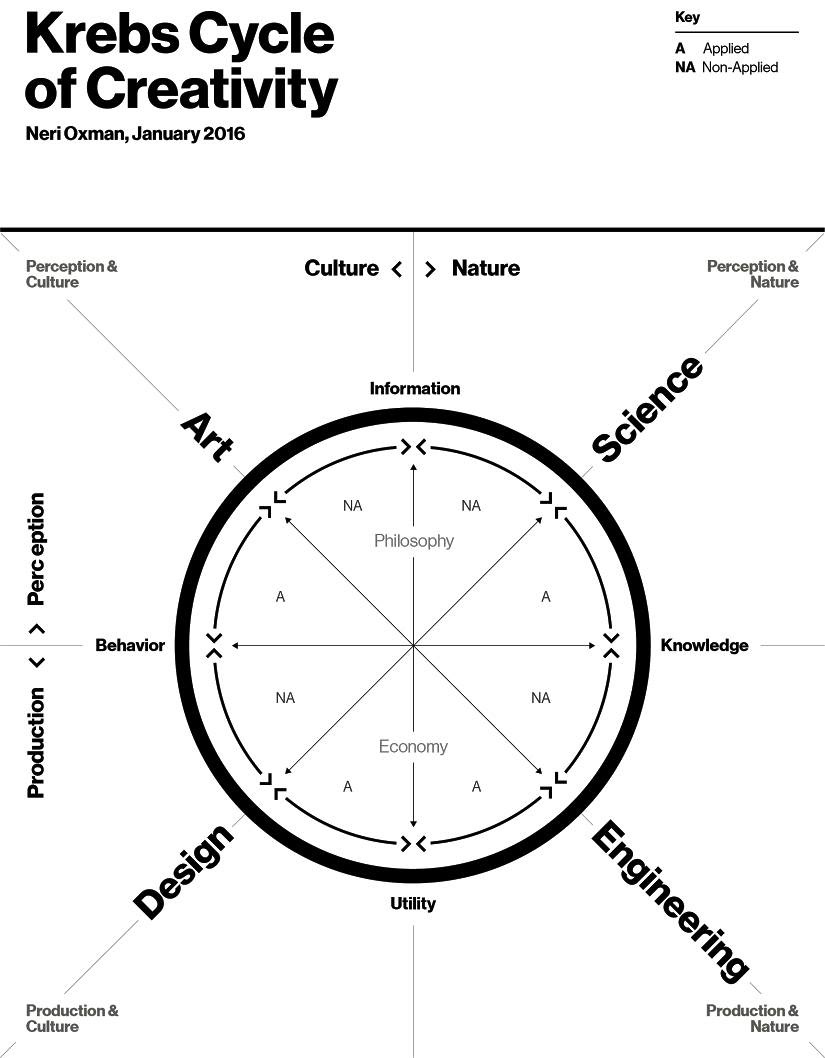
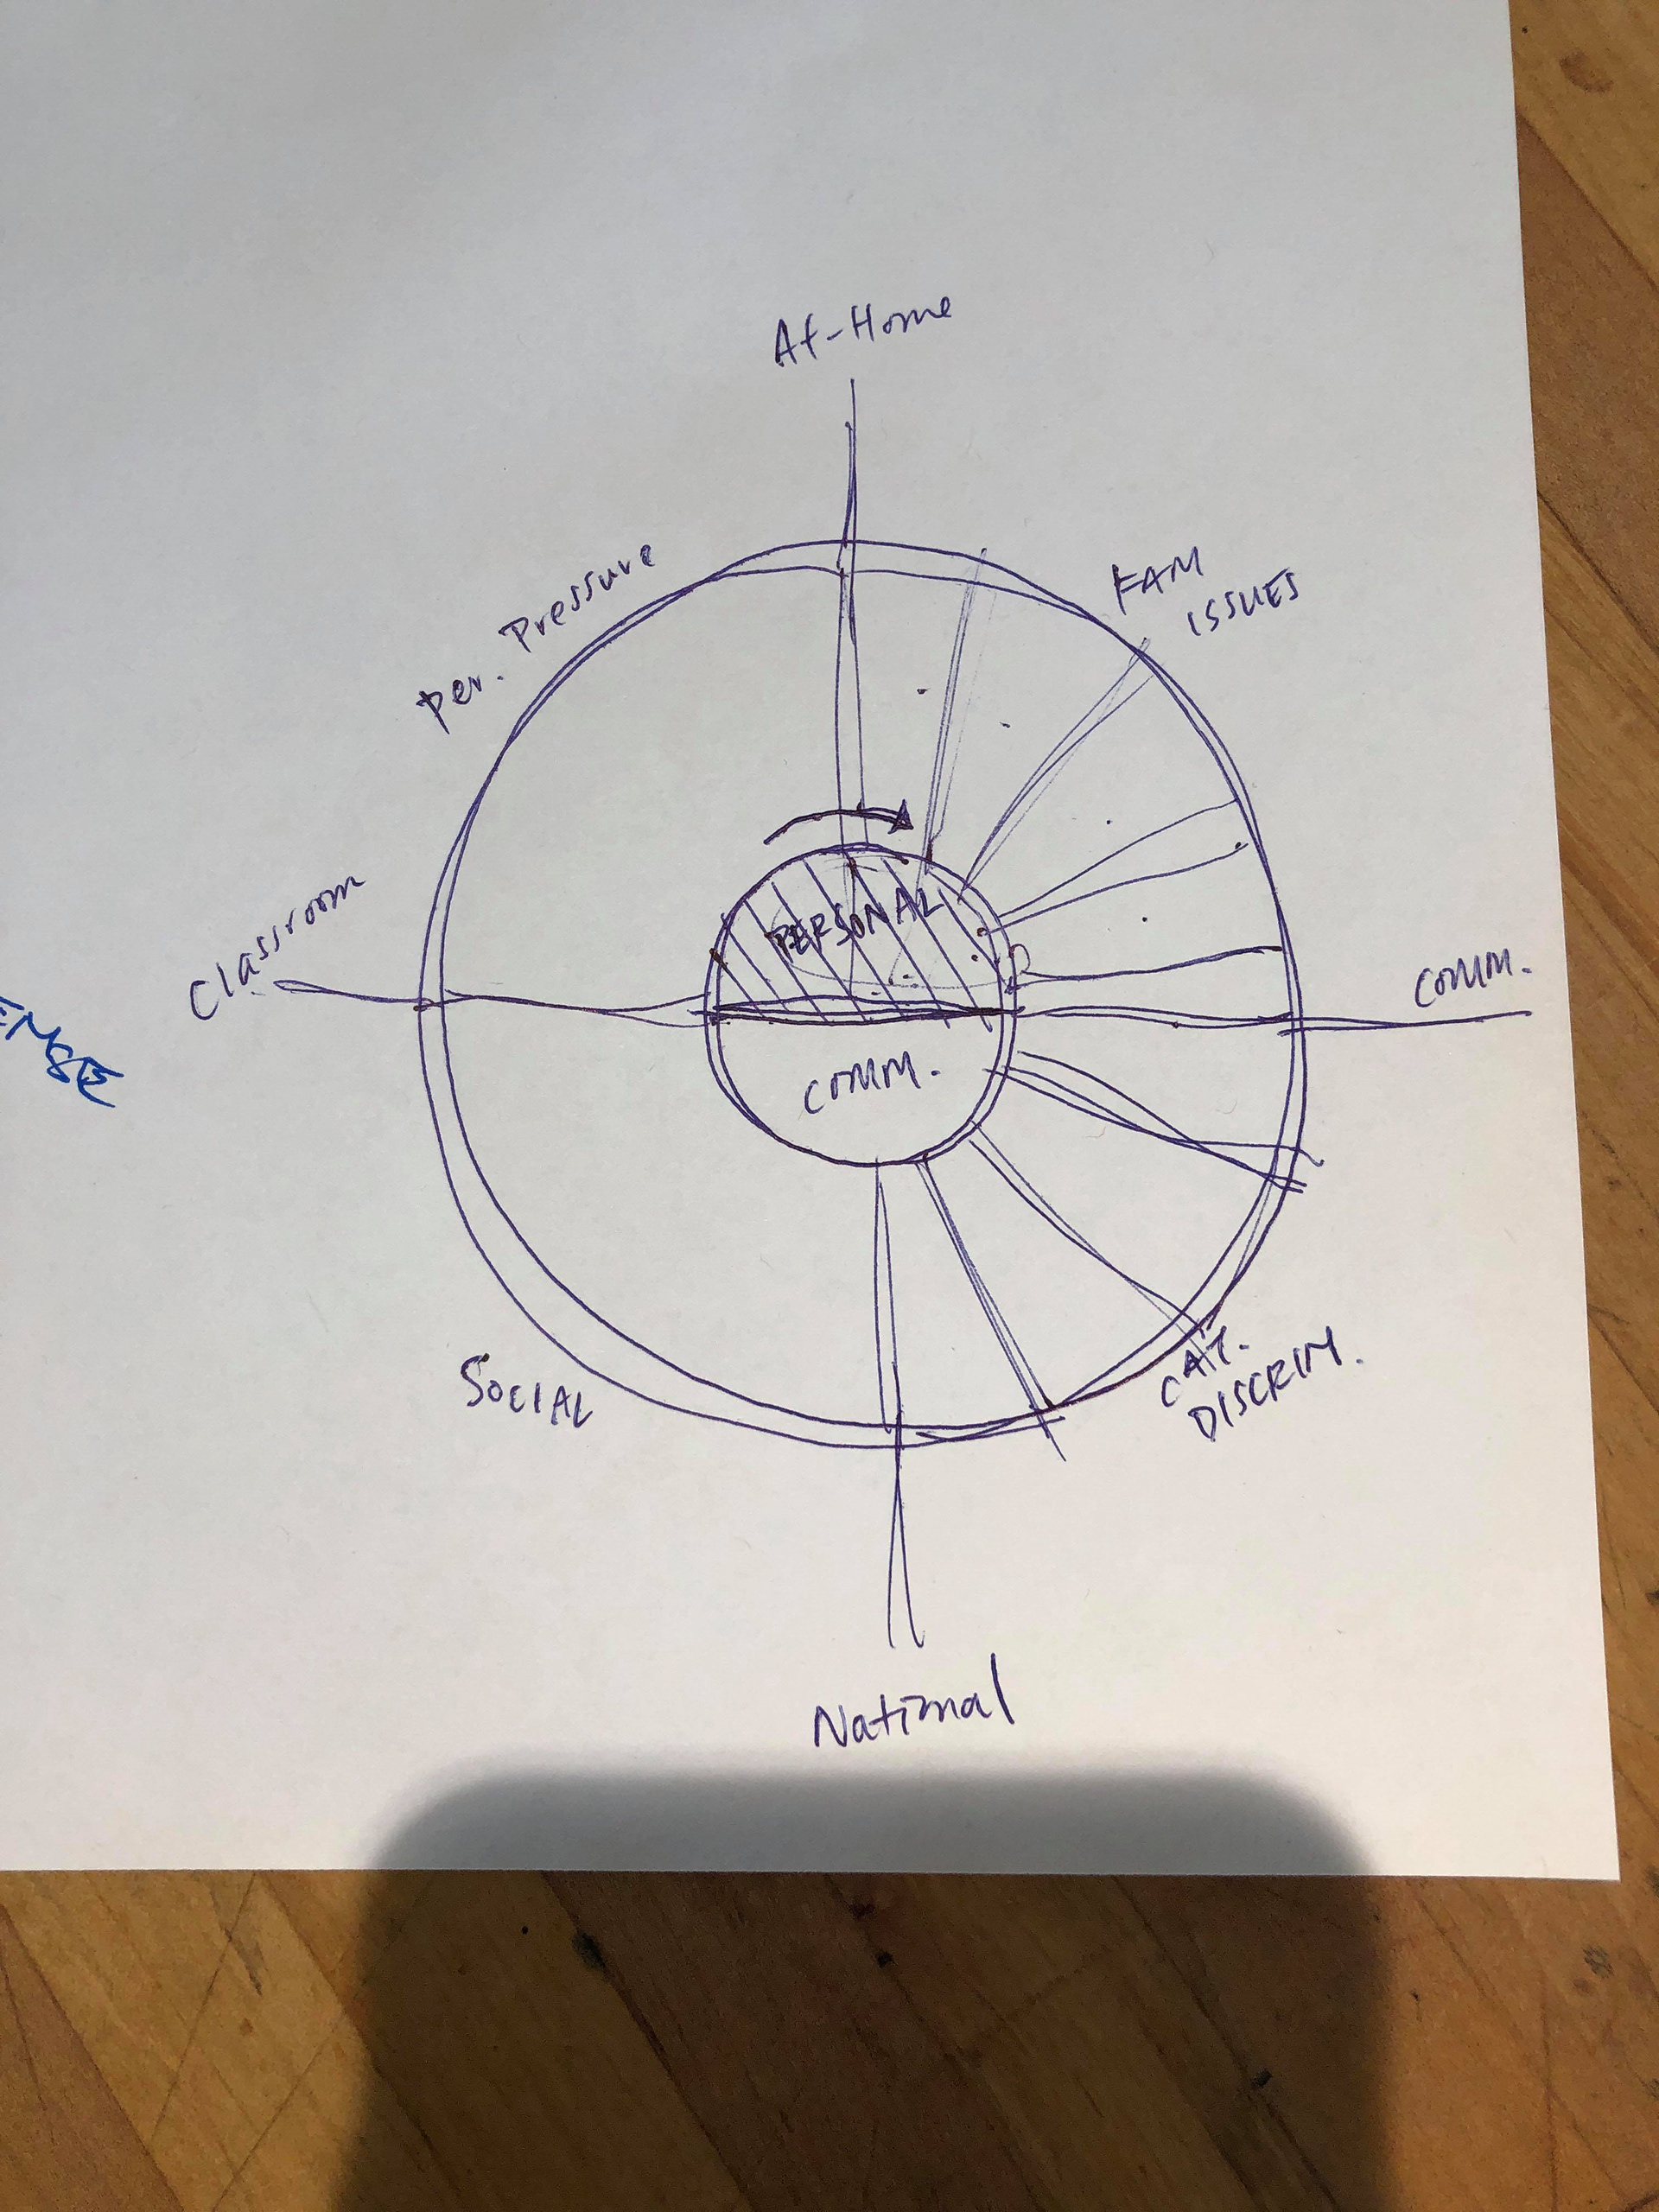
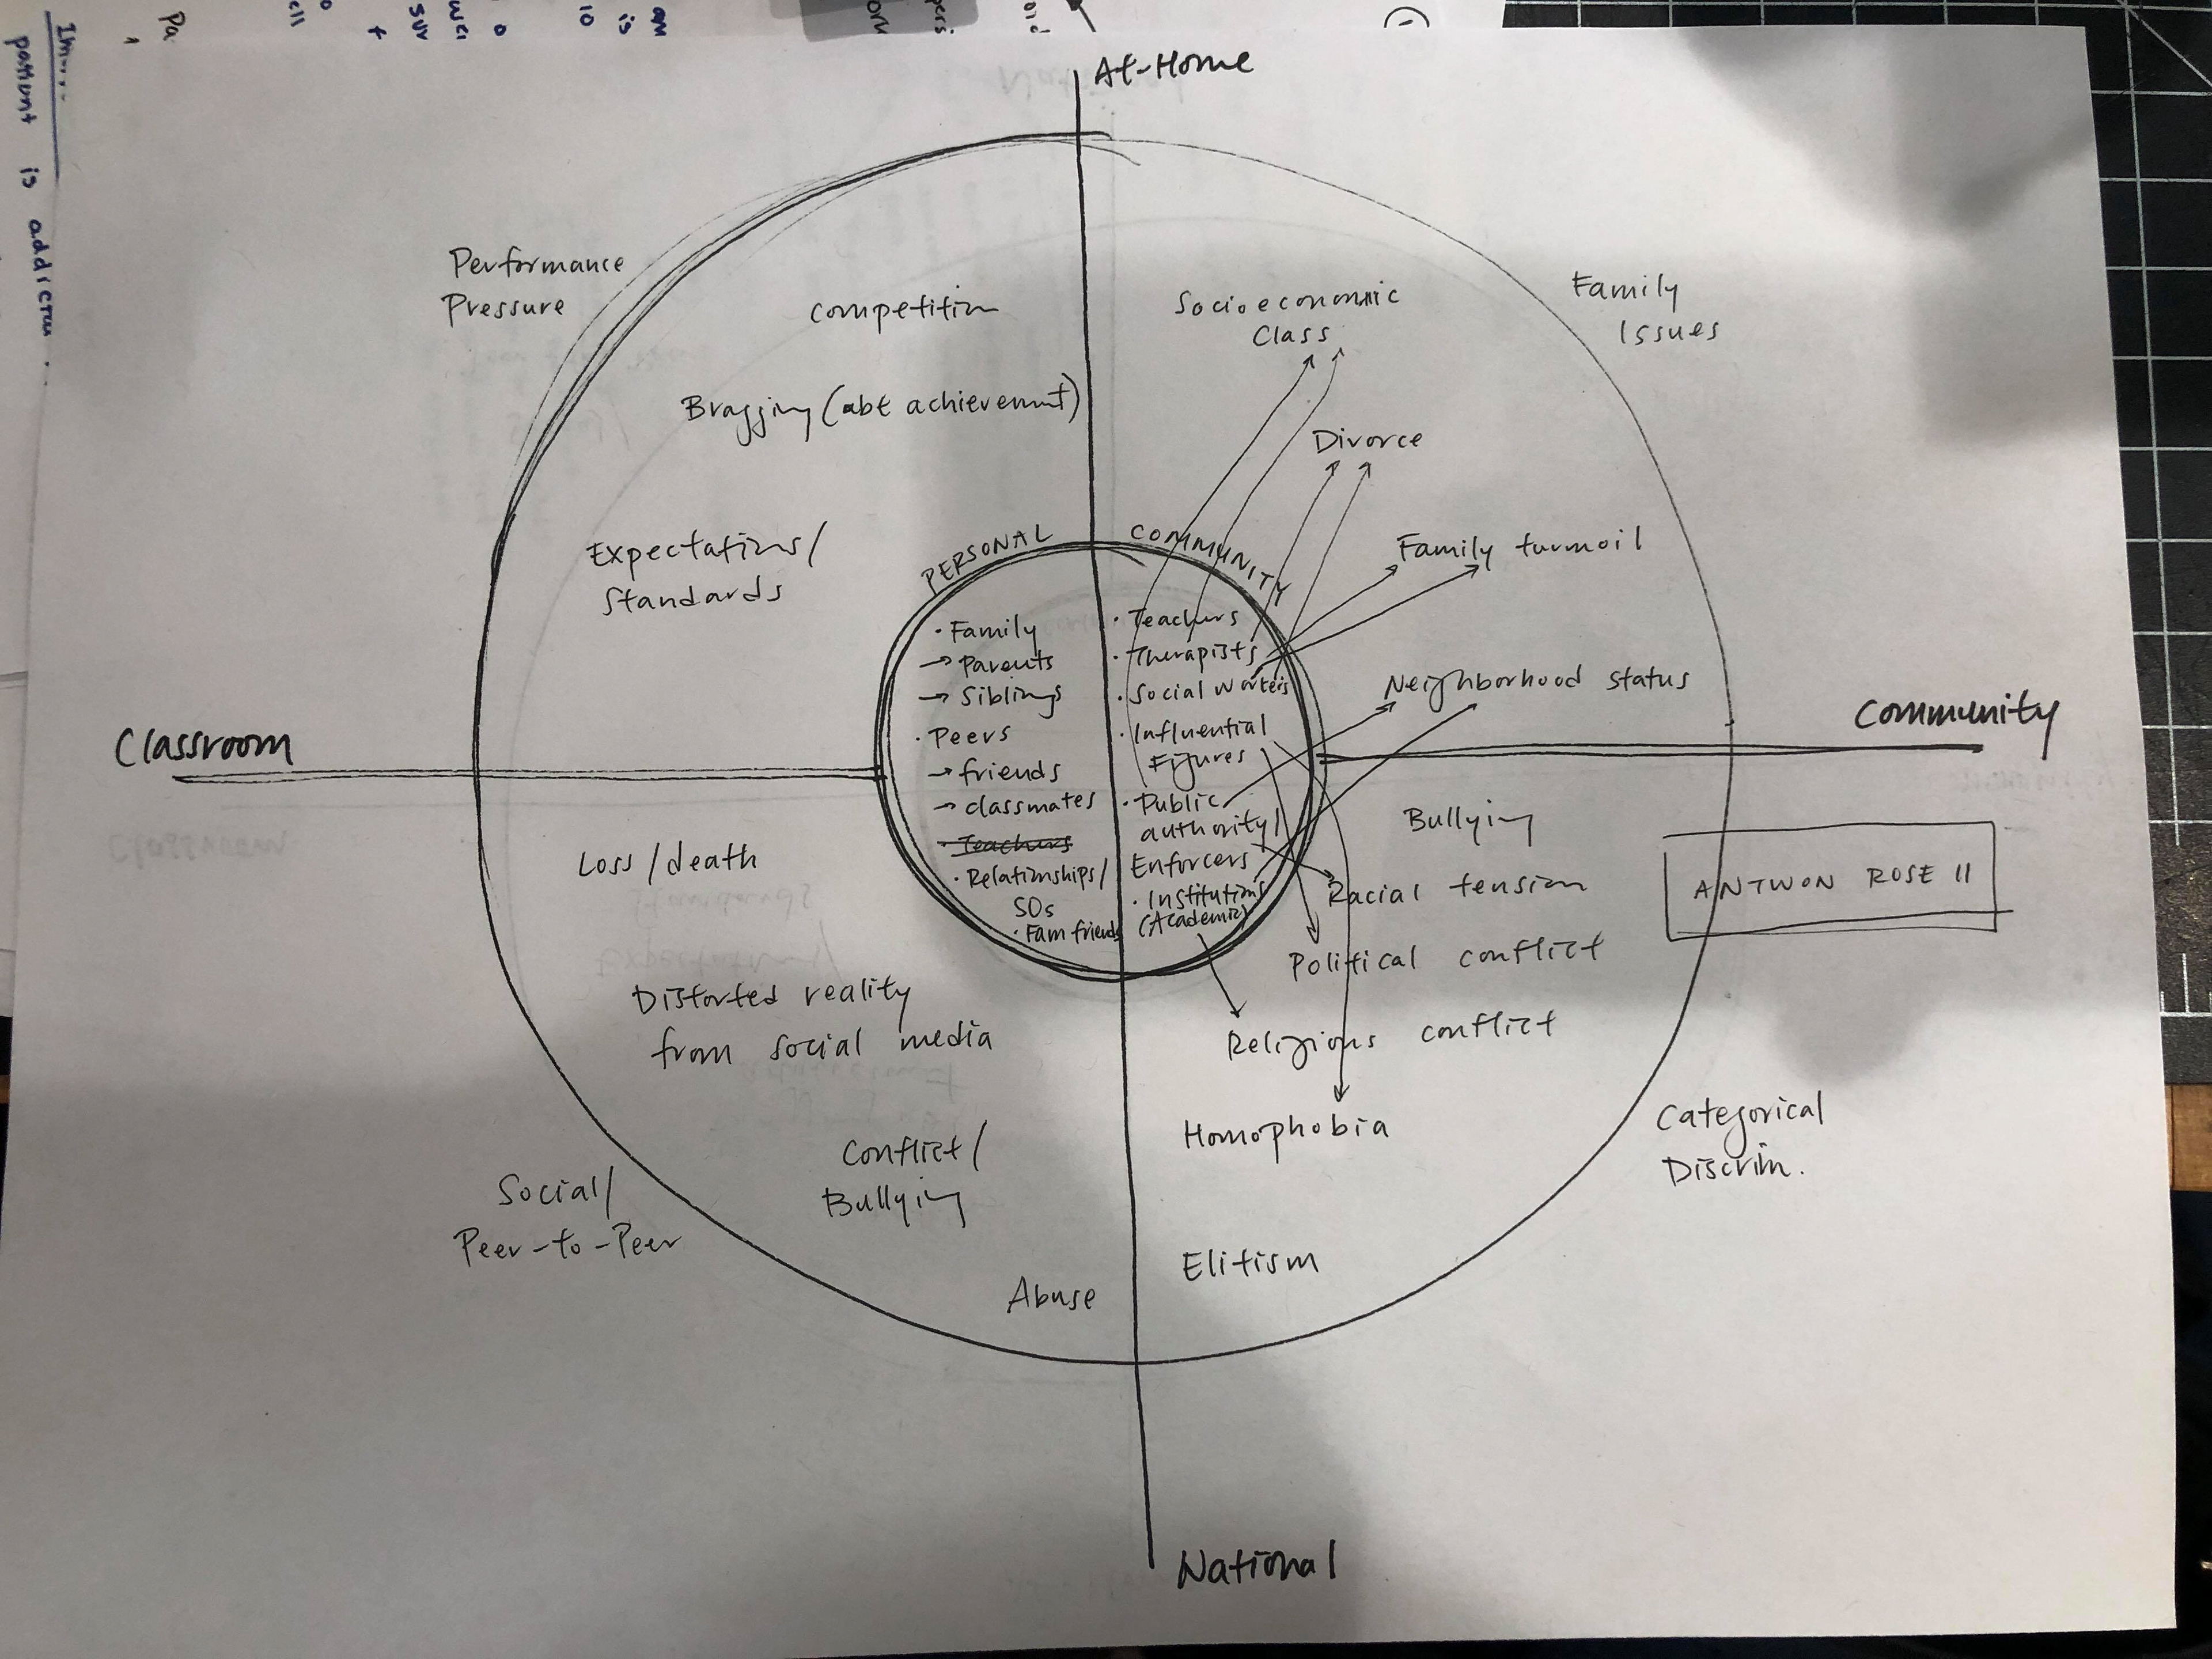
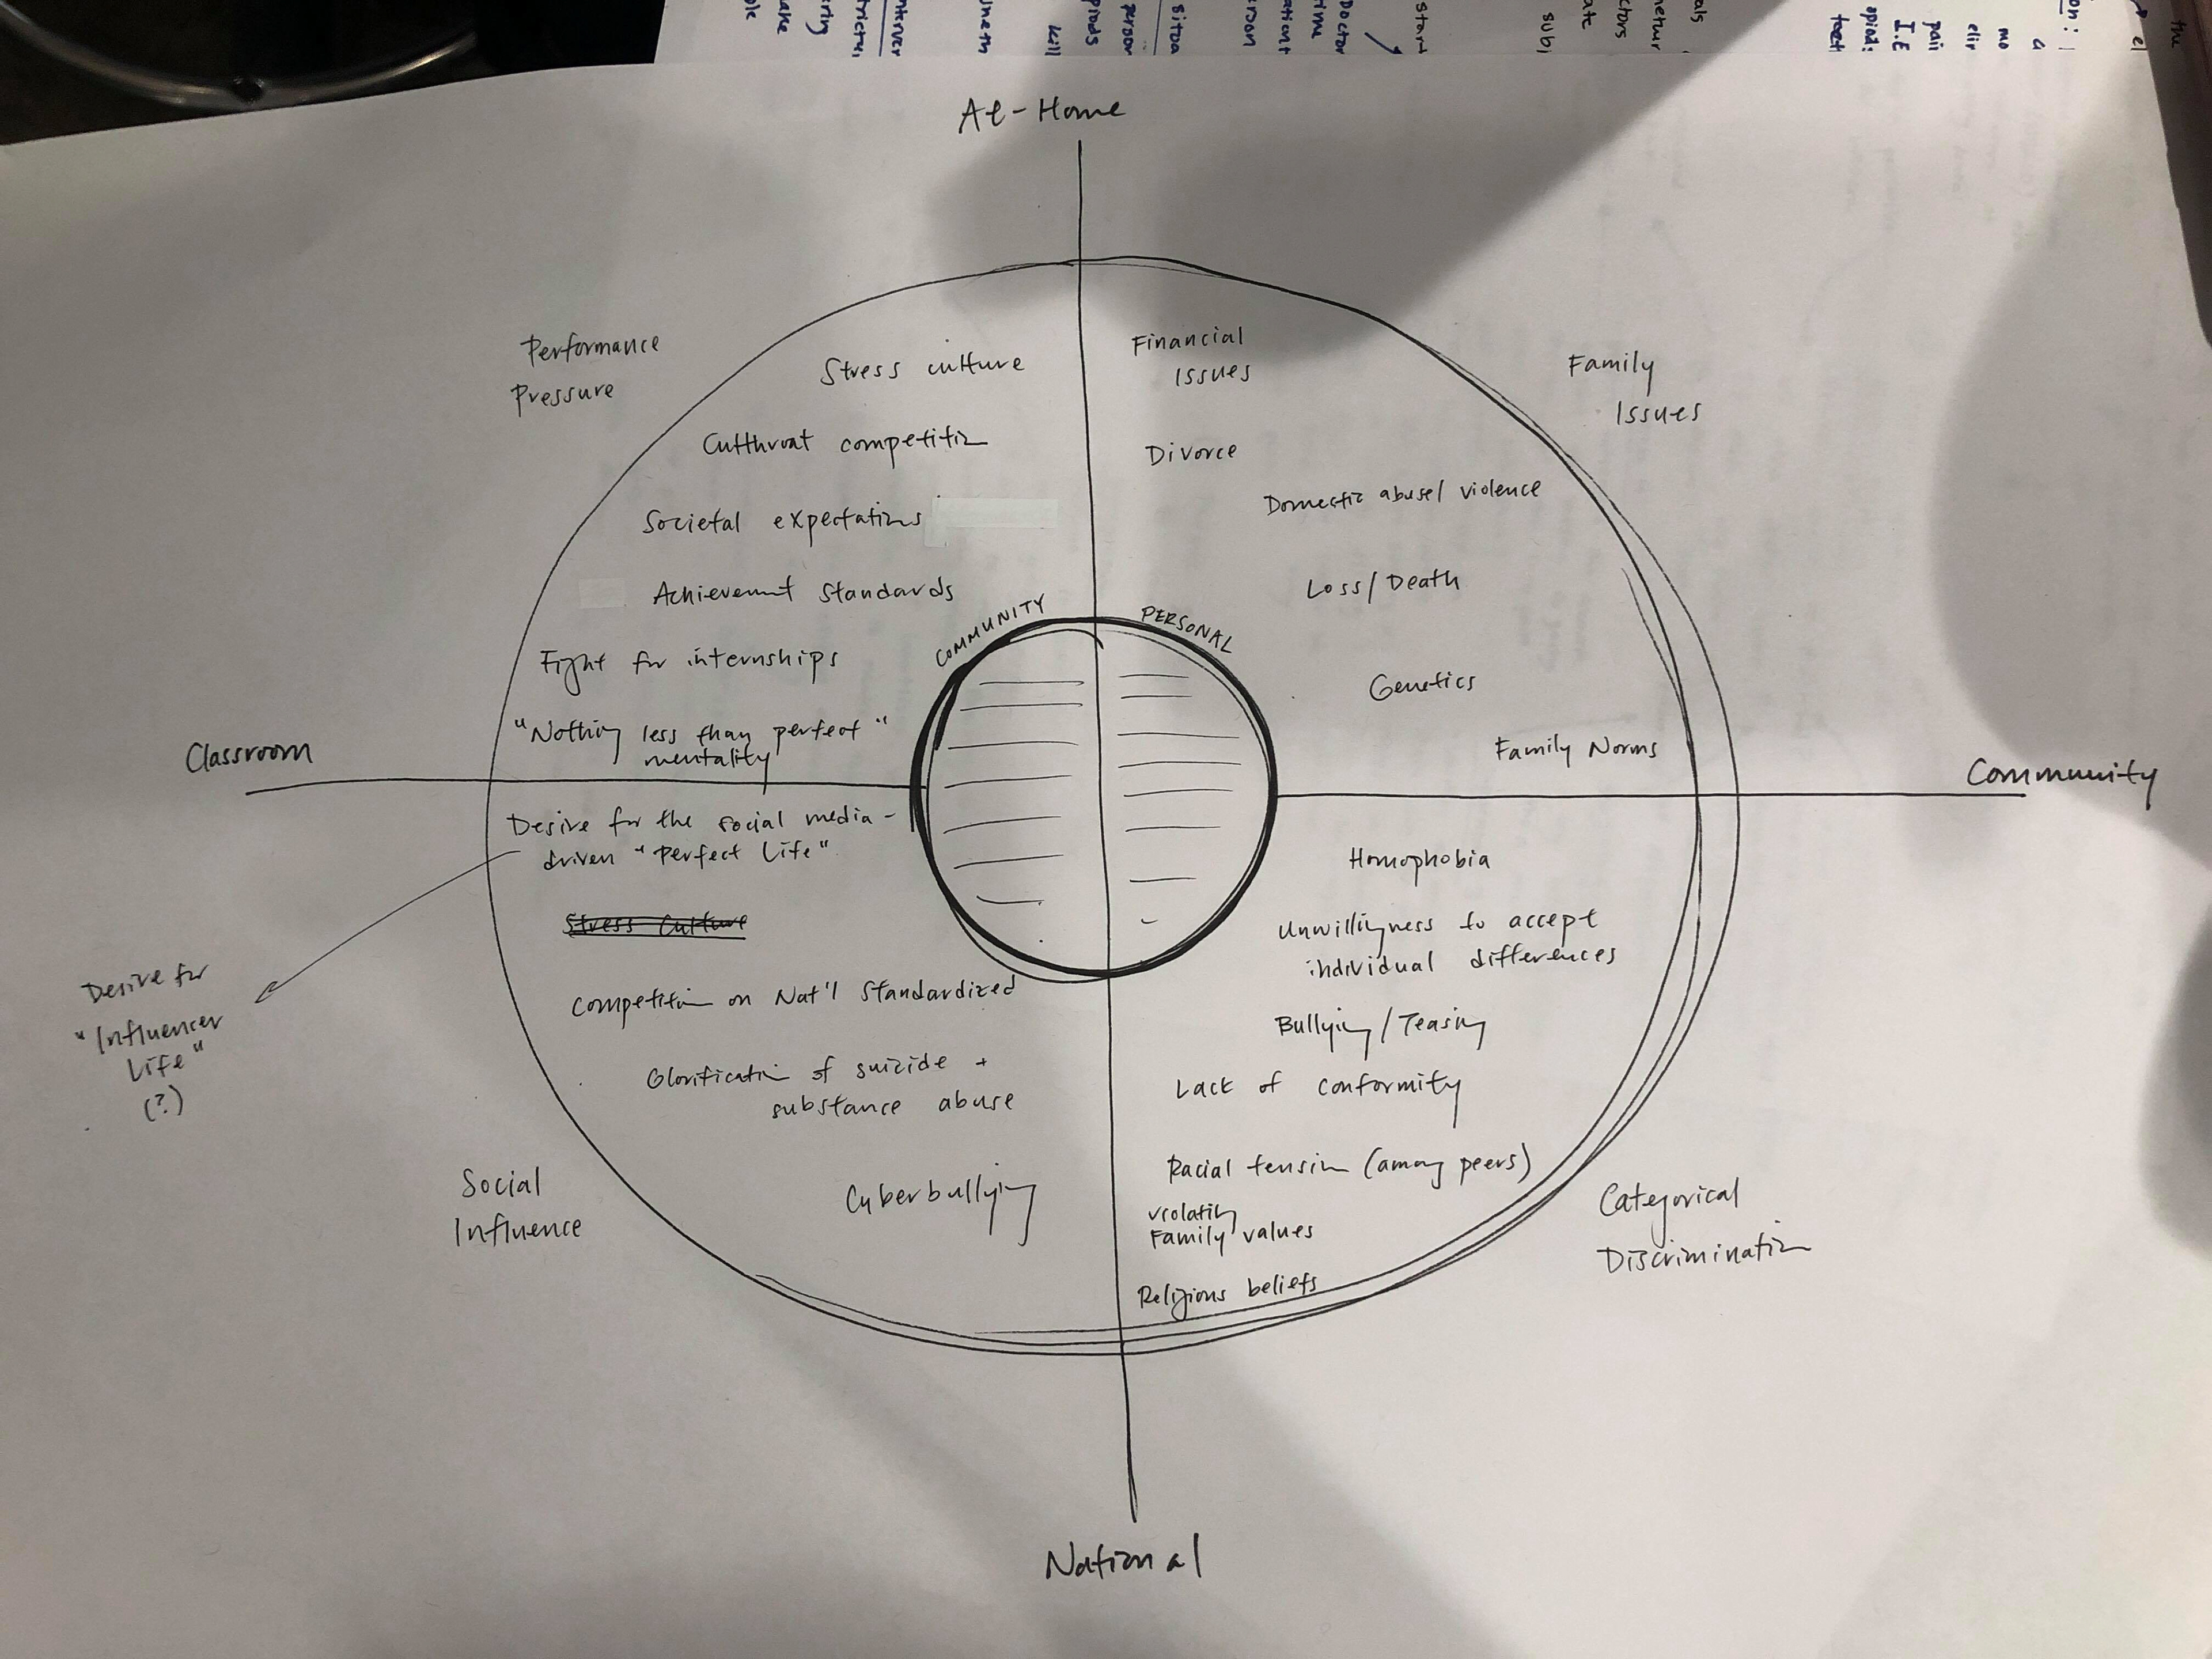
We decided to change up the focal point of the map (the center) to be more dynamic, taking inspiration from the Krebs Cycle of Creativity. We set up two axes, Classroom to Community and At-Home to National, then placed the four major clusters within the axes. In the center we split up the Individual to contain two halves, Personal stakeholders and Communal stakeholders. Outside the Individual were the primary and secondary causes as influencing factors, arranged properly along the axes. The Individual circle would turn like a wheel, with the Personal and Communal switching sides, and the influencing factors changing to indicate the switch.
INTERVENTIONS:
Once we solidified the concept behind our second iteration, we designed six interventions at three different scales, Classroom scale, Community scale, and National scale. Each intervention also had a specific leverage point at which the intervention should be carried out.
LEVERAGE POINTS
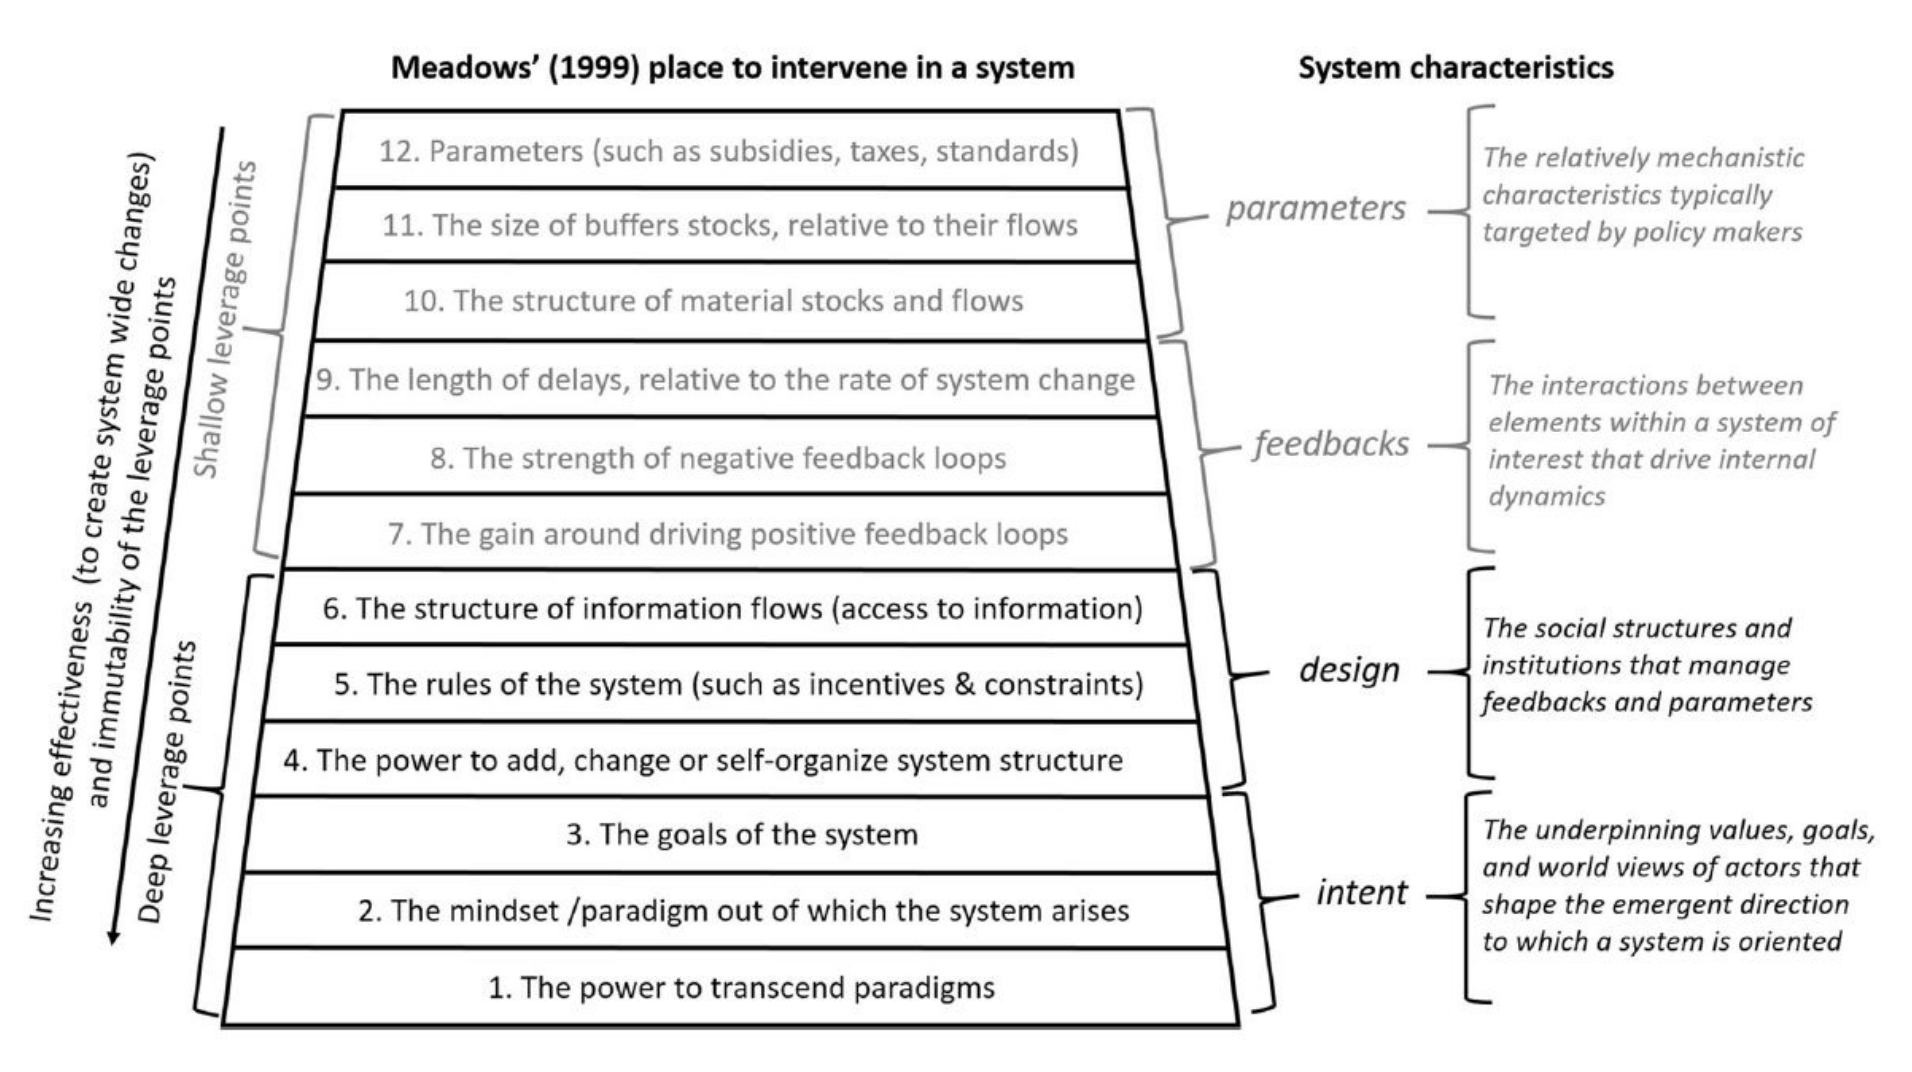
Leverage points are places to intervene in a complex system; at a leverage point, a small shift can result in a large change in the dynamic of the system. Donella Meadows, a systems analyst, defined twelve leverage points of any system. Using Meadows' twelve points helped us decide the significance of each of our interventions and the impact we wanted it to have.
FINAL MAP:
Our final map includes two perspectives, reflecting the switch between Personal and Communal stakeholders. If we had had more time on this project, we definitely would have created an animation of this 180° switch and presented that as our final map.
We also decided to remove the significance of the axes (Classroom to Community and At-Home to National from Map Iteration 2) but keep the lines as dividers for the four main clusters as sectors. Feedback concluded that that was unnecessary noise on the map and a little redundant, since we already labelled the clusters.


Final version of our map: printed as two 24" x 36" posters.
KEY TAKEAWAYS:
This was definitely an eye-opening project for me that gave me a stronger understanding of the complexity of wicked problems and the steps necessary to tackle them. I also gained a better understanding of and appreciation for systems thinking, and how any complex problem can be broken down into smaller subsystems, which can then help identify important relationships, patterns, and ultimately solutions.